

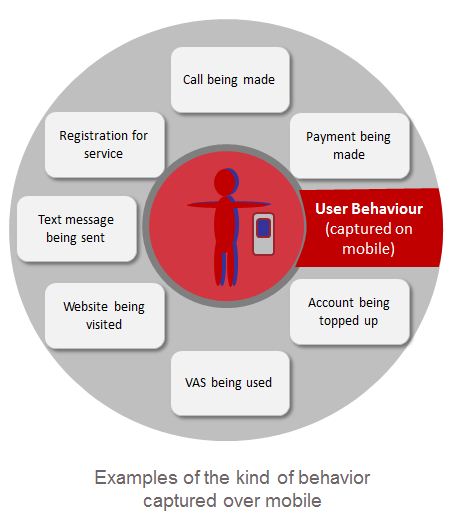
Mobile services have a distinct advantage over other delivery methods: they can easily capture information about customer behaviour. Analysing the quality of the user base and customer behaviour patterns can lead to specific recommendations for service improvement – if we have a replicable way of producing this analysis, we also have a way of testing whether changes produce the improvements we expect.
In my last mAgri blog post I wrote about hypotheses formed when we segmented the mKisan customer base into push-content only users, trial IVR users and repeat IVR users. GSMA’s mobile agriculture team and M4D impact team recently co-presented a webinar (view slides and the webinar recording) showing how these methods can be deepened and broadened to encompass a range of mobile services.
Following the logic of the MMU customer journey segmentation we experimented with data from an Agri VAS (anonymised and called ‘xAgri Info’ for the purposes of freely available public research) to create a segmentation based on three variables:
- Number of service accesses;
- Length of engagement with service (date of last activity – date of first activity);
- Length of time since last access.
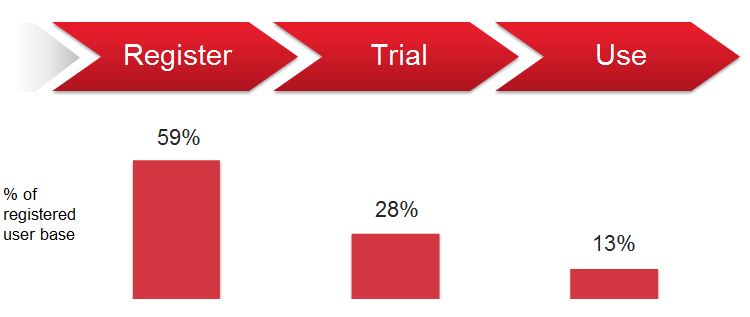
So whereas previously our understanding of the customer base looked like this…
… A more detailed segmentation allows us to understand customer activity more temporally, like this:
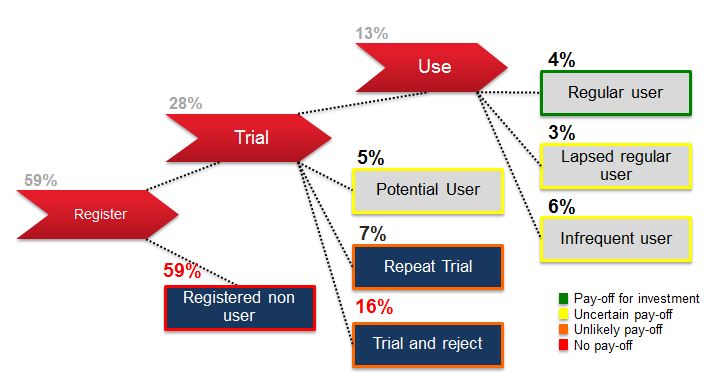
Applying this information can help to identify where the greatest value is currently to be found in your user base; and where the biggest gaps are in relation to service design, content and marketing. However, this view doesn’t change the immediate priority of understanding how to bring ‘registered non users’ into the active user base. In fact it provides a sobering reality check for service providers in terms of the user base quality. Whether you have a user base of 100, or 10,000, or 1 million, a consistent problem of 59% registered non-users represents an issue that just grows with your user base. This is an important lesson for the industry: scale must come with quality – user registrations aren’t enough.
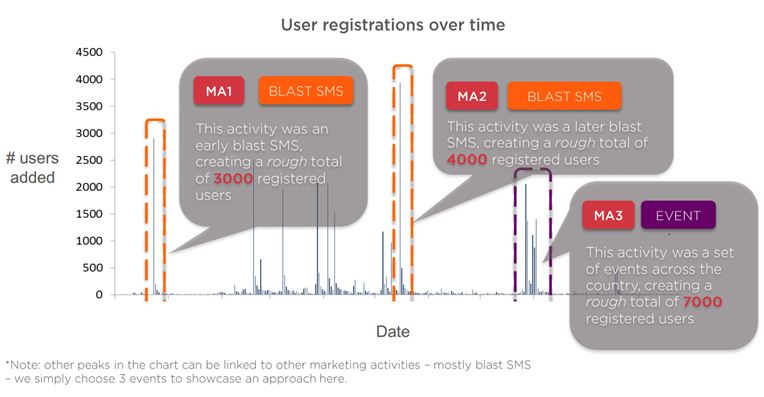
Excitingly, this analysis also outlines methods to analyse marketing campaigns (identified by spikes in customer acquisitions) in terms of the quality of customers they produce. See the full M4D impact case study to understand why marketing campaign ‘MA1’ below might be considered the most valuable of the three campaigns studied even though it generates the lowest number of new users.
Similar analysis could be applied to different content types to identify differences in their ability to generate quality customers.
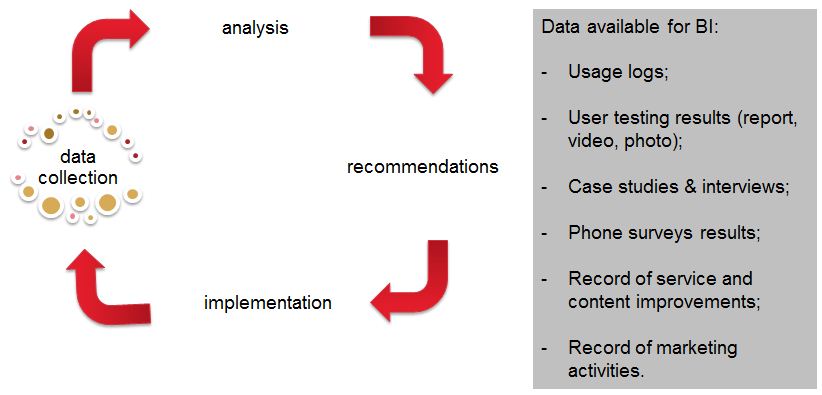
As ever, quantitative data on customer behaviour patterns generates many more questions than it answers! The only way to understand the ‘why’ of these activities is to couple these data insights with available qualitative information, including insights from monitoring and evaluation work. My last blog outlined questions you might ask customers across the segments; these could be refined based on this deeper understanding of customer behaviour. Other sources of data available for business intelligence are: user testing results, phone surveys, interviews, record of marketing activities and service improvements. In combination with qualitative insights, data-based evidence of challenges can be formed into concrete recommendations. Implementation of these recommendations can be further monitored and re-analysed in a process of continuous service improvement.
We think these methods are a promising way forward for understanding success in terms of business and impact in mobile agriculture. If you have ideas, insights or comments, please share below or get in touch – we’d love to take the industry conversation forward here.