

The post is part of a series looking at key findings from the 2014 State of the Industry Report on Mobile Financial Services.
Last week, we discussed the accessibility of mobile money services, focusing on the two distinct channels that customers use to access mobile money services. In this post, I will try to answer the following question: How has the adoption of mobile money evolved in 2014?
How many mobile money registered accounts are in the world?
The number of registered mobile money accounts is a good indicator of global growth of the mobile money industry. There were just under 300 million registered mobile money accounts by the end of December 2014. This is a remarkable milestone for the industry, as the number of registered mobile money accounts now exceeds the populations of mega markets such as Brazil and Indonesia. While the mobile money industry has had impressive growth in the past couple of years, the number of registered accounts only accounts for an 8% penetration of 3.7 billion mobile connections in the markets where mobile money services are available.
Mobile money continues to drive financial inclusion: 16[1] countries have more mobile money accounts than bank accounts in 2014, compared to 9 in 2013 and only 4 in 2014.
How is the industry prompting active customer usage?
The number of active mobile money accounts is important for understanding the speed at which customers are adopting mobile money services. At the end of 2014, the industry surpassed 100 million active accounts on a 90-day basis, which represents an active rate of 34.6% of the 300 million registered mobile money accounts. When looking at activity on a 30-day basis, 67 million (22.4%) of the 300 million registered accounts were active.
Perhaps some of this growth in active rates is attributable to a natural evolution. But time, albeit helpful, has not been the main driver causing the growth. The industry has become more intelligent in incentivising active usage, operators are increasing investment and testing innovative tools to better serve active users and reward usage.
The map below shows the breakdown of registered and active mobile money accounts by region.
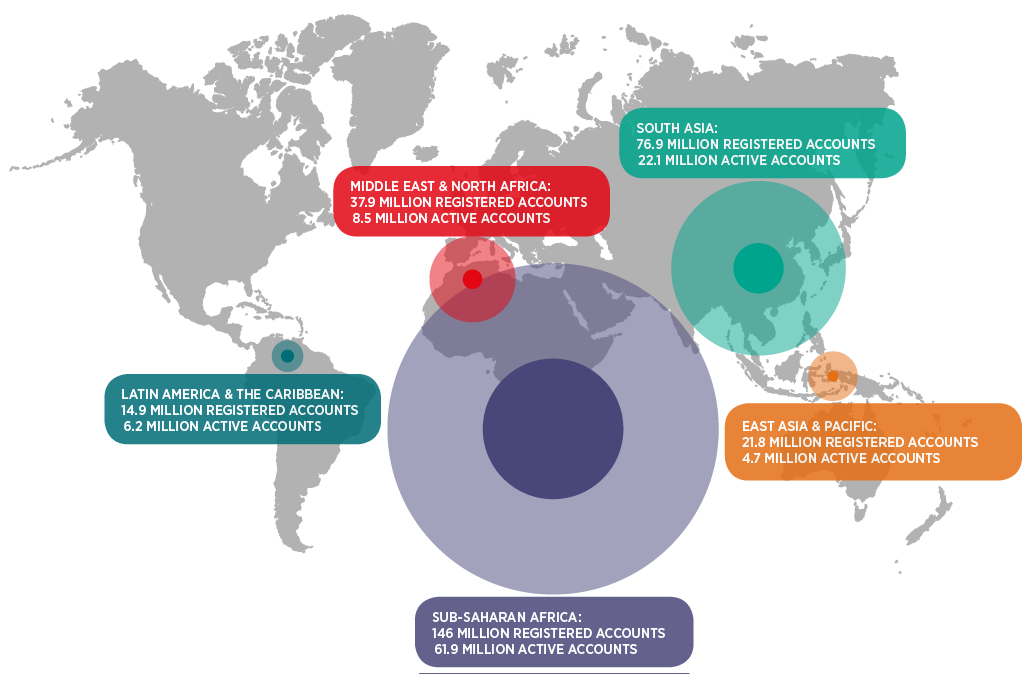
Of all regions, Sub-Saharan Africa still has the highest proportion of mobile money registered accounts. To get a better idea of the prevalence of mobile money as compared to other fast-growing products, we can compare mobile money penetration with smartphone penetration in the same region. By December 2014, 23.0% of mobile connections in Sub-Saharan Africa were linked with a mobile money account, whereas smartphone connections only represented 16.4% of total mobile connections in this region.In East Africa, the contrast is even starker with almost one mobile money account for every two mobile connections, compared to a smartphone penetration of only 12.5%.
At the end of 2014, 21 services had more than one million active accounts[2], seven of which passed this threshold during 2014. It is important to highlight that of the 21 services with over one million active accounts, five actually had more than 5 five million active accounts.
How is the industry reaching customers at the bottom of the pyramid?
To maximise its socio-economic impact, mobile money needs to sustainably reach people at the bottom of the economic pyramid. Regardless of the level of maturity of their service, there are fundamental indicators which mobile money providers can use to improve their visibility of underserved segments, including the collection of demographic data to identify and track usage amongst women and rural customers. However, only 24% of survey respondents said they know what proportion of their customers reside in a “rural area” and only 23% reported that they know the gender composition of their customer base.
Interestingly, survey respondents who participated both this year and last year reported an overall increase in the penetration of mobile money services among women and among rural customers. Of the 13 respondents who reported both last year and this year, eight respondents saw their penetration increase and five remained stable for both segments. Registered rural users increased to an average of 48% of all users this year, up from 43% last year. If we consider the average proportion of women in the customer base, it has also slightly increased globally to 38% from 36% last year.
Much of this growth in these segments is due to the overall growth of the registered mobile money base, but some MNOs have managed to drive adoption by adapting their strategies and tactics specifically for underserved segments.
What about unregistered mobile money users who transact over-the-counter (OTC)?
A mobile money transaction is considered OTC when it is conducted through an agent’s account on behalf of a customer. OTC transactions can be offered formally, whereby the provider has deliberately implemented an OTC strategy for commercial and regulatory considerations, and where OTC users are considered ‘unregistered’. OTC transactions can also emerge informally and organically, despite deliberate commercial and regulatory attempts to limit its use.
In our annual Global Adoption Survey, we collect supply-side data on formal OTC usage only. In 2014, 9.8% of mobile money services globally were being delivered primarily through OTC usage.[3] In markets such as Pakistan, OTC is widely used for various kinds of transactions, including bill payments and person-to-person transfers. Five of the six services that reported more than one million unregistered users in June 2014 were based in Pakistan.
Survey respondents reported 33.3 million unregistered users transacting OTC in June 2014. While the number of unregistered mobile money users is still growing, this year growth was slower than the growth of active mobile money accounts.In some cases, this deceleration is due to service providers’ investments and efforts in migrating their OTC customer base to registered users. In other cases, this deceleration is simply because providers have reached a saturation point in the number of unregistered customers who are transacting OTC.
In the next post in our series, we’ll explore mobile money usage, looking at the values and volumes of mobile money transactions in 2014, and what people are using mobile money for.
Notes
[1] Burundi, Cameroon, the Democratic Republic of Congo, the Republic of the Congo, Gabon, Guinea, Kenya, Lesotho, Madagascar, Paraguay, Rwanda, Swaziland, Tanzania, Uganda, Zambia and Zimbabwe
[2] On a 90-day basis
[3] Services which had more unregistered users transacting in June 2014 than active accounts during this month were considered as services delivered primarily over-the-counter.