


Globally, there are more women than men living with a disability: one in five women live with a disability compared to one in eight men. Many women lack adequate access to healthcare and safe employment and face persistent gender-based violence in many places, which results in ill-health for many and, as a consequence, becoming disabled. For women with disabilities, the situation is further complicated as they face not only gender inequalities but, also, disability-related discrimination and stigma. Women with disabilities are sometimes perceived as unable to fulfil their expected roles or as being powerless which can result in their isolation and marginalisation.
For women with disabilities, mobile can provide life-changing benefits and help them to overcome these intersectional challenges. Previous research by the GSMA has shown that women associate mobile with improved wellbeing and that persons with disabilities find mobile helpful to access different services (such as healthcare, education and employment) and to perform everyday tasks (including shopping, work and school activities). However, little is known about the extent of the digital inclusion of women with disabilities.
Our GSMA Connected Women and Assistive Tech teams analysed data from the GSMA Intelligence Consumer Survey 2019 (covering seven low- and middle-income countries) to better understand the characteristics of digital inclusion of women with disabilities. The message is clear: women with disabilities are disproportionately digitally excluded and are at risk of being left behind in our ever more digital societies.
Women with disabilities have low levels of mobile ownership and are the least likely to own smartphones
Women with disabilities have the lowest rate of mobile ownership in all the research countries except for Kenya (see Figure 1). Remarkably, we found that even in countries where the mobile ownership gender gap is inversed or close to zero, such as Mexico and Brazil, a gender and disability gap exists. The disability gap across the seven countries is relatively large, ranging from seven per cent in Kenya to 47 per cent in Bangladesh. Our analysis suggests that disability is a significant predictor of mobile ownership and compounds the gender gap.
Figure 1 Mobile ownership by persons with and without disability, by gender and country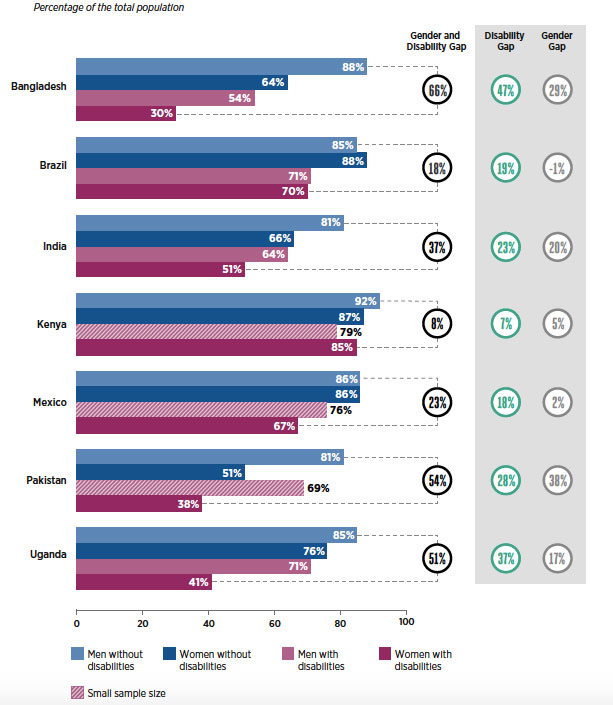
Source: GSMA Intelligence Consumer Survey, 2019. Based on survey results for adults aged 18 and over. Mobile ownership is defined as having sole or main use of a SIM card (or a mobile phone that does not require a SIM), and using it at least once a month. n = from 39 to 226 for women with disabilities, n = from 425 to 873 for women without disabilities, n = from 20 to 210 for men with disabilities and n = from 423 to 1069 for men without disabilities.
Regardless of gender, persons with disabilities perceive mobile as less beneficial than non-disabled persons
In past research, we found that mobile ownership has been associated with wellbeing benefits for both men and women. We also found this to be the case in our research. When asked about perceived benefits of mobile in the Consumer Survey, both men and women with and without disabilities in Brazil, India, Kenya and Uganda reported overwhelmingly that mobile helped them with their chores, provided them with a feeling of safety and gave them convenient access to information (see Figure 2).
However, persons with disabilities reported the benefits to a lesser extent than non-disabled persons. This is not to say that benefits were not perceived: for instance, in Kenya, all women with disabilities reported that mobile helped them with work, school and home chores. Although mobile may have a strong role to play as an assistive technology, it is still perceived as least useful by persons with disabilities. Even when women with disabilities own a mobile, they do not benefit from it as much as other groups. Findings on the perceived benefits of mobile reveal opportunities to make mobile more relevant to those who are benefitting the least.
Figure 2 Comparison of the reported benefits of mobile in Brazil, India, Pakistan and Uganda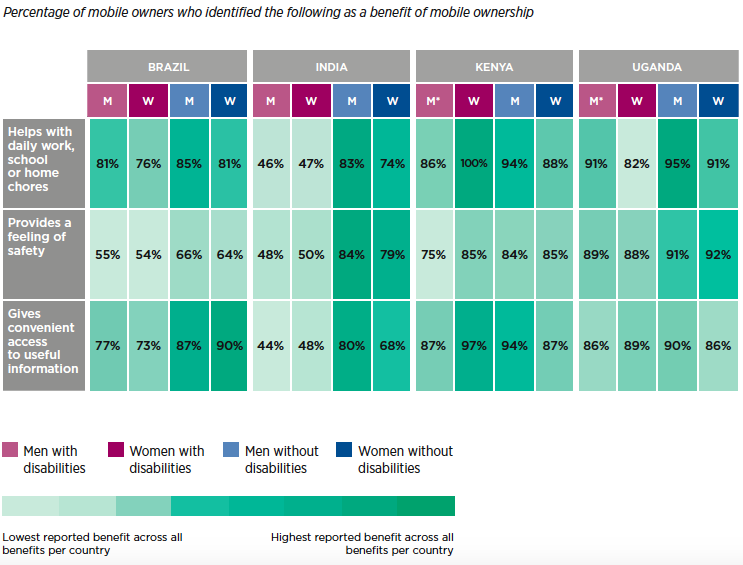
Source: GSMA Intelligence Consumer Survey, 2019. Based on survey results for adults aged 18 and over. Respondents have sole or main use of a mobile phone. n = from 31 to 103 for women with disabilities, n = from 290 to 461 for women without disabilities, n = from 16 to 127 for men with disabilities, and n = from 348 to 837 for men without disabilities. * Denotes small sample size (n<30) and should be interpreted with caution.
Relevance, literacy and skills, and safety and security are common barriers to mobile ownership for women with disabilities
When looking at the reported reasons for not owning a mobile, there are a few common barriers for women with disabilities that are important to highlight. For 70 per cent of women with disabilities in Uganda, information security was a reported barrier while in Bangladesh and India the lack of relevance of mobile was reported by nearly 40 per cent of women with disabilities (see Figure 3). In Pakistan, a range of barriers were reported by more than half of women with disabilities. These barriers consisted of: the lack of knowledge of how to use a phone; the lack of relevance of mobile; strangers contacting them or information security. Strategies to close the mobile ownership gap experienced by women with disabilities need to address these barriers.
Figure 3 Comparison of reported barriers to mobile ownership by women with disabilities in Bangladesh, India, Pakistan and Uganda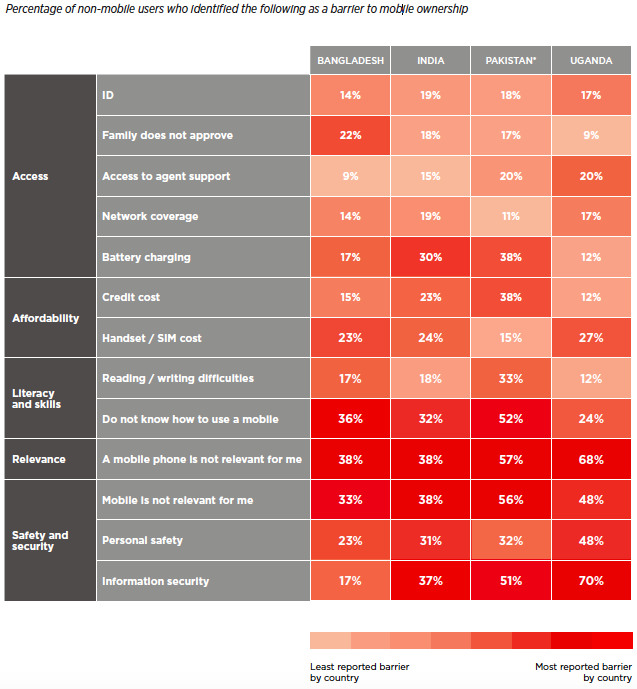
Source: GSMA Intelligence Consumer Survey, 2019. Base: Non-mobile owners aged 18+ Mobile ownership is defined as a person having sole or main use of a SIM card (or a mobile phone that does not require a SIM), and using it at least once a month. Percentages indicate the proportion of non-mobile owners who responded, “This is something that is stopping me” to the question, “For each of the possible reasons that I read out, please indicate whether this is something that stops you at all from having a mobile phone or SIM card, connected to a mobile operator’s network.” n = from 29 to 112. * Denotes a small sample size (n<30) and should be interpreted with caution.
Mobile internet use is low amongst women with disabilities
The levels of mobile internet use were the lowest amongst women with disabilities in the seven markets surveyed. Similar to mobile ownership, disability plays a factor in mobile internet use and compounds the gender gap. Brazil and Mexico, both countries with a negative gender gap in mobile internet use, have relatively large gender and disability gaps (more than 40 per cent). In Bangladesh, not a single woman with a disability reported having used mobile internet in the last three months.
Figure 4 Mobile internet use by gender and disability prevalence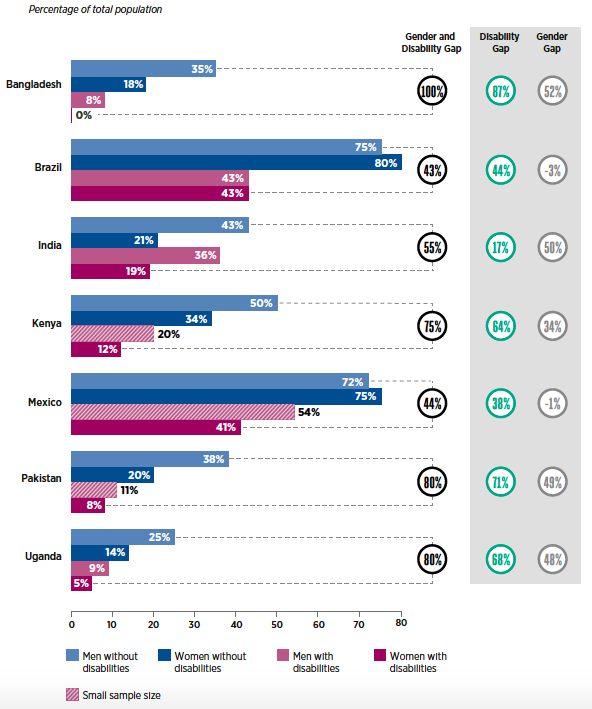
Source: GSMA Intelligence Consumer Survey, 2019. Based on survey results for adults aged 18 and over. Respondents were asked if they have used the internet on a mobile phone in the last 3 months. n = from 39 to 226 for women with disabilities, n = from 425 to 873 for women without disabilities, n = from 20 to 210 for men with disabilities and n = from 423 to 1069 for men without disabilities.
What can be done to improve the digital inclusion of women with disabilities?
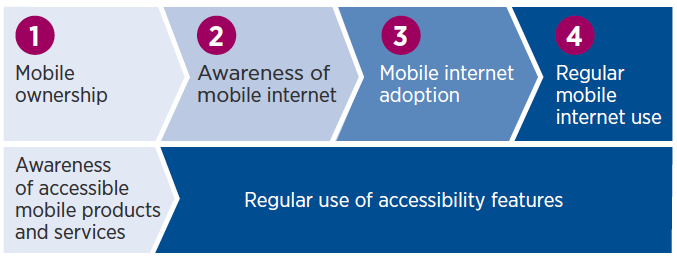
Women with disabilities face a diverse range of barriers to mobile ownership and mobile internet use. Actions taken to improve their digital inclusion need to consider the complexities at the intersectionality of gender and disability status. It is imperative to understand how disabilities may change their experiences across the mobile internet user journey (see Figure 5). Raising the awareness of accessible mobile products and services is fundamental for the digital inclusion of persons with disabilities.
Figure 5 The mobile internet user journey of women with disabilities
Based on our research, in order to effectively address the barriers that women with disabilities face regarding their digital inclusion, the following actions are required:
- Developing and raising awareness of relevant products and services to address the needs of women with disabilities
- Address safety and security concerns experienced by women with disabilities
- Support women with disabilities to acquire and develop their digital skills
- Improve the availability of disability and gender-disaggregated data on mobile access and use
Through these actions, we can find innovative and effective approaches to ensuring that digital development does not leave women with disabilities behind.