A man in a brown knitted hat and dark jacket sits on a step, smiling as he holds a mobile phone for a selfie. Beside him, a woman in a bright pink sari and scarf crouches, also smiling, with a wooden door and sunlight in the background.

The State of Mobile Internet Connectivity 2025

Six reports, one series: The latest data and insights on global mobile internet adoption, barriers and opportunities for digital inclusion.
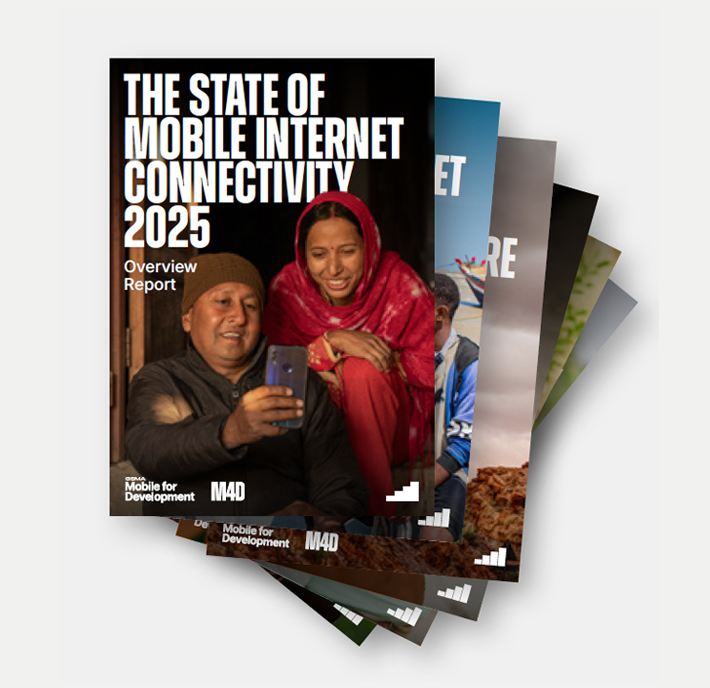
A man in a brown hat and black jacket sits on a doorstep, holding a mobile phone and smiling. Beside him, a woman in a red sari and headscarf looks at the phone, also smiling. They are in warm light, outside a rustic building with a red wooden door.

Overview Report

Three tall mobile phone masts stand between rocky, reddish-brown hills under a cloudy, overcast sky. The masts are made of metal and some have aerials or dishes attached. The landscape is rugged, with sparse vegetation on the hills.

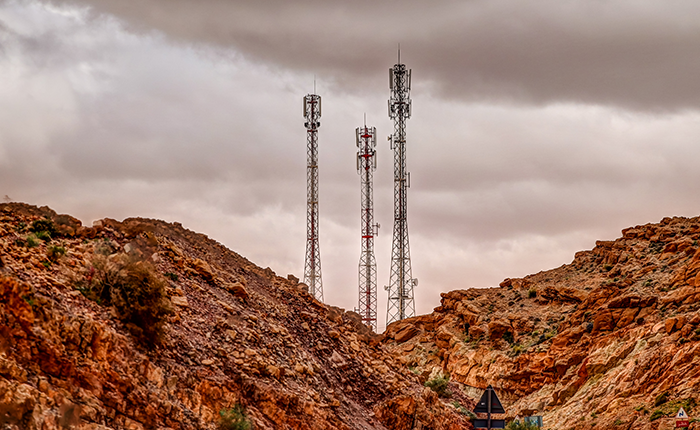
Network Coverage and Infrastructure

An elderly woman in colourful traditional clothing sits cross-legged on a patterned bed outdoors, smiling as she uses a mobile phone. She wears a light blue outfit, a bright headscarf, and several bangles. The background is a faded wall with a soft, neutral tone.

Barriers to Mobile Internet Adoption and Use

Three young men sit on a weathered wooden boat by the sea, looking at a mobile. They wear casual clothes; one has headphones around his neck. Other boats and people are visible in the background under a clear blue sky.

Trends in Mobile Internet Connectivity

A person wearing a yellow patterned dress uses a mobile phone outdoors. Their hand is touching the screen, browsing photos or social media. Another person in a dark, floral outfit stands nearby. The background is blurry, showing reddish-brown ground.

Understanding Mobile Internet Use in LMICs

A woman wearing a colourful knitted hat and leopard print top stands outdoors in a lush, green field, looking down at a mobile phone in her hand. She holds a wooden stick and appears focused, with trees and vegetation in the background.

Affordability of Internet-Enabled Handsets and Data

Explore the latest global data

  • Global
  • East Asia & Pacific
  • Sub-Saharan Africa
  • Latin America & Caribbean
  • South Asia
  • Middle East & North Africa
  • North America
  • Europe & Central Asia

Global

2015
2024
19 %
4 %

Coverage gap

49 %
38 %

Usage gap

33 %
58 %

Connected

East Asia & Pacific

2015
2024
5 %
1 %

Coverage gap

47 %
22 %

Usage gap

47 %
76 %

Connected

Sub-Saharan Africa

2015
2024
46 %
10 %

Coverage gap

42 %
65 %

Usage gap

11 %
25 %

Connected

Latin America & Caribbean

2015
2024
15 %
5 %

Coverage gap

49 %
32 %

Usage gap

36 %
63 %

Connected

South Asia

2015
2024
30 %
4 %

Coverage gap

58 %
50 %

Usage gap

12 %
46 %

Connected

Middle East & North Africa

2015
2024
23 %
3 %

Coverage gap

48 %
50 %

Usage gap

29 %
46 %

Connected

North America

2015
2024
1 %
1 %

Coverage gap

37 %
18 %

Usage gap

62 %
81 %

Connected

Europe & Central Asia

2015
2024
6 %
1 %

Coverage gap

43 %
22 %

Usage gap

50 %
77 %

Connected

  • Global
  • East Asia & Pacific
  • Sub-Saharan Africa
  • Latin America & Caribbean
  • South Asia
  • Middle East & North Africa
  • North America
  • Europe & Central Asia
Mobile internet connectivity
3G, 4G & 5G
Download speeds
This graph shows the evolution of global mobile internet connectivity from 2015 to 2024, including the percentage of people connected, the coverage gap and the usage gap.
This graph shows the trend in 3G, 4G and 5G coverage from 2015 to 2024.
This graph shows the trend in download speed from 2015 to 2024.
Key:
Coverage gap
Usage gap
Connected
3G
4G
5G
Download speed

Previous reports

Browse past editions of The State of Mobile Internet Connectivity.

Subscribe for updates

Get the latest insights on mobile internet connectivity and digital inclusion straight to your inbox. Be the first to know when new reports in this series are published.

A man wearing a red and white jacket and a traditional hat stands in a green field of crops, looking at a mobile phone in his hands. Greenhouses, trees, and a clear blue sky are visible in the background.


Please note that only entity email domains will be accepted


Logos of UK International Development and Sweden Sverige. The UK logo features a Union Jack flag and the words “UK International Development, Partnership, Progress, Prosperity.” The Sweden logo shows the Swedish flag and the text “Sweden Sverige”.

The Connected Society programme is supported by UK International Development from the UK Government and the Swedish International Development Cooperation Agency (Sida) and is supported by the GSMA and its members.