

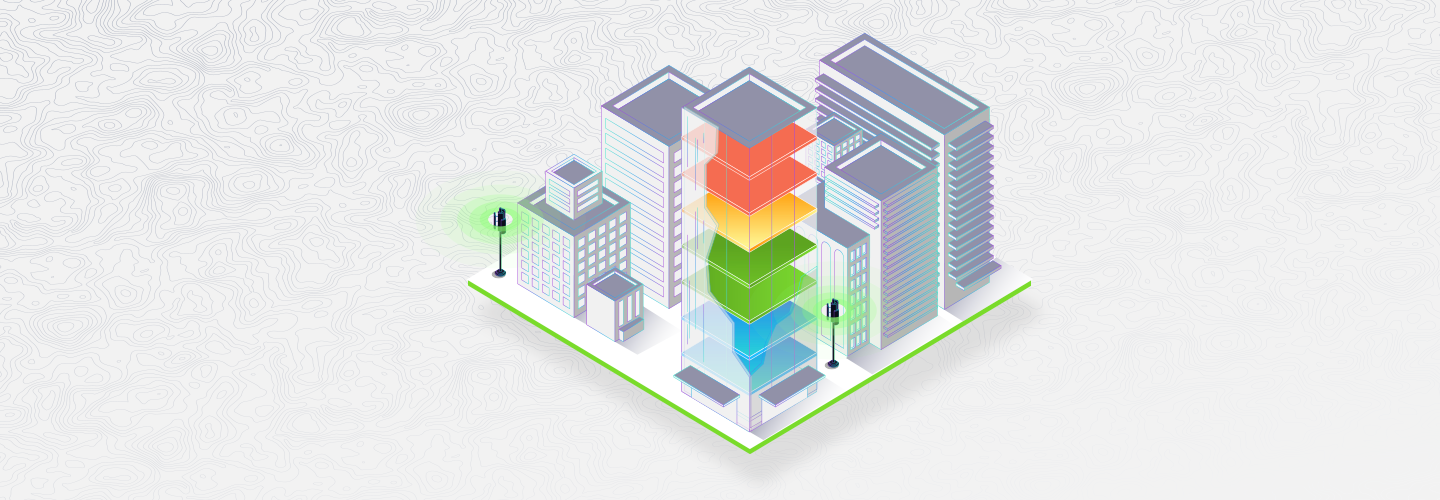
Tall buildings present a particular challenge when analyzing indoor mobile network performance and coverage, because those metrics can vary significantly by height. New 3D “z-axis” views in Cell Analytics™ from Ookla® allow mobile network operators to spot problems at specific elevations that a traditional two-dimensional view could miss.
Powered by hundreds of millions of daily performance, coverage and signal measurements from Speedtest®, Cell Analytics provides unparalleled intelligence about wireless service quality, RF measurements, data usage, indoor and outdoor user density, cell site locations and much more — surfaced in one intuitive platform. With the release of the new 3D views, operators can use this real-world data to pinpoint areas of poor mobile service, down to individual floor groups in buildings.
Network engineering and planning teams can see metrics like LTE RSRP, RSRQ, RSSNR and more, broken out vertically in 15-meter intervals. This article will explore three ways operators can use these powerful new views.
View conditions and user density by height in buildings
Cell Analytics provides data from locations that are not accessible by traditional data collection methods like drive testing and walk testing, such as private businesses and residences. The new 3D views show how any operator’s network performance, coverage and quality vary by floor groups within individual buildings, as well as user density by floor group across all operators. These views help to identify areas of high user concentration within buildings where you are also experiencing poor performance.
In the below example, we looked at the Smart network in Manila. By examining RF conditions in floor groups with high user counts, we can identify floor groups in individual buildings where the Smart network is providing marginal or poor coverage to a large number of users. Conversely, we can see where Smart has a competitive advantage: superior RF conditions and a large pool of potential new subscribers.


Identify which buildings are suffering poor quality on upper floors due to interference
Performance and quality of a network can vary dramatically within tall buildings. A customer may have a variable experience on your network, depending on where they are located in a given building, which can make a critical difference in a populous office high-rise or on the ground floor of a hospital. Detailed in-building analysis can show by height where performance is suffering, down to individual floor groups.
Using the 3D z-axis view in Cell Analytics, you can see where optimization is needed to accommodate for variable performance in important buildings. In the below example, we can see Kwong Wa Hospital in Hong Kong. This large, 1141-bed hospital has high user density and sees good coverage, but poor quality, on the csl network. We can also see that coverage increases with height in this building, while quality decreases. This behavior indicates interference within the building — and highlights an area where csl may want to build a new cell site or focus optimization efforts on the existing network.


Identify buildings where your competitors have installed indoor systems
In addition to discovering areas of competitive strength and weakness, Cell Analytics z-axis views can help you discover where other operators have installed indoor systems, such as small cells or distributed antenna systems (DAS). By analyzing network performance and coverage data by floor group, you can determine the location of indoor cell sites, with high confidence.
If a tall building has excellent coverage and quality all the way through the uppermost floors, it is a likely indicator that the building contains indoor systems. Further confirmation can be provided by comparing the cell IDs serving users within and outside the building.

The 3D views in Cell Analytics can be panned, tilted and rotated to get a full view of in-building performance and coverage. Never before has it been so easy to explore network metrics in the locations that are most important to your customers — at all elevations.