Benin is a relatively new market for the Pay-as-you-go (PAYG) Solar home system (SHS) industry, but growth has been strong in recent years. According to GOGLA, West Africa as a whole has been a key growth market for PAYG solar providers, “In the first half of 2019, sales [of both PAYG and cash-sale solar products] were over 350,000 units, a 32 per cent increase from the second half of 2018. The PAYG segment in particular was responsible for a 50 per cent increase, almost reaching parity with cash sales in the region, with 170,000 units sold.” (Read our recent blog on West Africa’s evolving PAYG ecosystem). In parallel, it is no surprise that mobile money adoption has seen a similar growth trend during the same period, as the GSMA pointed out in a recent report. It is easy to see that PAYG triggers mobile money adoption and usage for customers living in remote communities, by having them make regular energy payments, but there is little evidence to quantify it.
This is why the GSMA Mobile for Development (M4D) Utilities programme has collaborated with several mobile network operators (MNOs) across different African countries to understand how the introduction of PAYG has impacted their subscribers’ activity, both in terms of mobile money usage, and mobile phone activity in general.
We asked MNOs to collect and aggregate data from their subscribers that have initiated payments to a PAYG SHS provider during the last 12 – 18 months. Ideally, the data should range from six months before customers start using the service to six months after initial purchase. In order not to breach individual privacy, we asked MNOs to group all PAYG clients that share the same subscription month into a single cohort. This allowed us to anonymously measure the impact seen on multiple cohorts for a series of chosen indicators over time.
To confirm that the impact is likely caused by the introduction of PAYG and not by external factors, we also asked the MNOs to compute the same indicators with the same methodology, but for a control group. This is a group of clients that have NOT enrolled in a PAYG SHS service, but have a generally similar customer profile as the other group, in order to be able to compare across similar socio-geographic segments.
Below, we highlight insights about the commercial impact for MNOs in Benin. The results of our broader study will include five other markets in Africa, and will be published in a report later this year.
Clear surge in mobile money transaction frequency
In Benin, we analysed data from 15 different cohorts with an average size of 1,500 users per cohort between April 2018 and June 2019 (22,500 users in total). In parallel, we have compared the result to a control group of 9,500 clients randomly selected during the same time period.
![]()
In the above graph, we see a strong positive impact of the introduction of PAYG solar on mobile money transaction frequency for all cohorts. The vertical axis is the average number of mobile money transactions per user per month, while the horizontal axis represents the relative month to the activation month date (Time 0) of PAYG. The growth for the cohorts varies between 71 per cent and 130 per cent. On average, we have measured a positive impact of 113 per cent for the frequency of mobile money transactions.
This increase was expected as these clients need to make mobile money payments to the PAYG vendor in order to be able to use their solar kit. Nevertheless, as the graph below shows, even after subtracting PAYG solar payments from the total number of transactions, we still observe a sharp increase of 65 per cent in transaction frequency. This means that PAYG not only drives mobile money transaction frequency through PAYG solar payments, but also generates other payment use cases that drive frequency.
![]()
In comparison, the growth measured for the control group is 27 per cent, during the same time period. There is a clear positive market trend to mobile money usage in Benin, but even when accounting for this growth, PAYG cohorts have considerably outperformed the control group.
In almost all of the markets that we studied, we have observed a similar impact on the mobile money transaction frequency. In Uganda for example, the PAYG cohorts have recorded a 93 per cent increase in the number of mobile money transactions per month, while the control group has merely seen a rise of 31 per cent during the same period.
Total value of transaction and revenue generated by mobile money increase as well
![]()

Diving deeper into the data on mobile money transactions in Benin, we see positive growth for both total value of transactionper user per month (graph on the left), which increased by 28 per cent, and revenue from mobile money transactions per user per month (graph on the right), which recorded 18 per cent growth.
Similarly, initial results from our analysis in Uganda seem to confirm this positive effect, with an increase of 47 per cent for the total value of mobile money transactions and 37 per cent for mobile money revenue among the PAYG cohort in Uganda.
PAYG SHS services introduce mobile money to many new clients

PAYG providers play an important role in driving mobile money penetration and providing customer education in remote rural areas. In Benin, among the 24,500 PAYG users monitored in this study, more than one-fifth of them (22 per cent) have either created or reactivated their mobile money account (becoming active again after 90 or more days of inactivity) to pay for their solar home system.
This trend is confirmed by comparable figures from other markets. In Zambia, almost a third of the PAYG client cohort (31 per cent) have activated their mobile money account for the first time, while in Uganda this figure reaches 21 per cent.
Adoption of PAYG SHS services generates growth for all MNO revenue streams
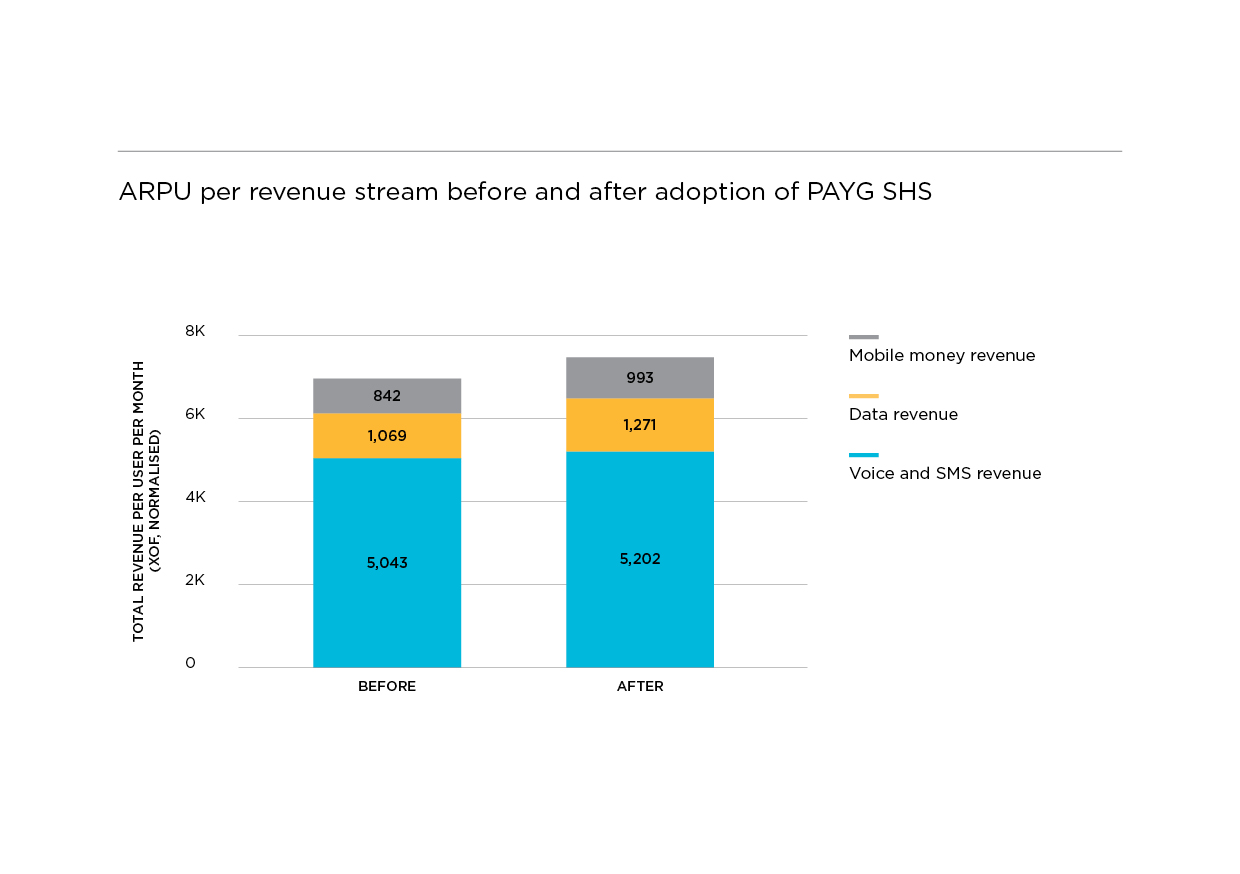
The impact on average revenue per user (ARPU) is always hard to read as there are many external factors that can influence this over a relative short period of time, like a seasonality effect or temporary MNO promotions. For this reason, the comparison with the control group is even more important as we can infer whether the observed impact is due to a market trend or due to PAYG.
Overall, PAYG cohorts have outperformed the control group, with a slight ARPU increase of seven per cent compared to an increase of one per cent for the control group. Even more interesting is the changing breakdown by revenue streams: Voice and SMS, data and mobile money. While voice and SMS revenues decreased by six per cent for the control group, this revenue stream has risen by three per cent for the PAYG clients. We observed the largest revenue increase for the data stream with 19 per cent growth among PAYG cohorts, compared to eight per cent growth for the control group.
This data tends to demonstrate that the adoption of PAYG SHS services has effectively increased ARPU for all revenue streams and has also outperformed the market trend.
Data from other countries have demonstrated similar impact on ARPU. In Zambia, the voice and SMS revenue among the PAYG cohort has grown by seven per cent in comparison to a stagnation (zero per cent) for the control group.
Pursuing data analytics will benefit collaboration between MNOs and PAYG solar providers
These first insights demonstrate the importance of using data analytics to better understand and measure the impact generated by partnerships between MNOs and PAYG providers.
The full report, bringing together data from five countries in West, East and Southern Africa, will be published in the second quarter of the year. It will shed more light on the relationship between PAYG solar adoption and mobile financial services by giving an in-depth analysis of the impact measured across countries. Our hope is that this will encourage more analyses of this kind to enable mobile operators and PAYG solar companies to measure how their joint efforts can achieve both partners’ business and social objectives. For mobile operators in particular, this can help guide their investments in these partnerships to generate the greatest value.
Of course, there are challenges with this kind of analysis, such as the essential protection of consumer privacy, accessing historical data over a long period of time, allocating MNO resources to data extraction and analysis, aligning the methodology in different contexts and more. These challenges can create ambiguities that are difficult to explain. A few studies, such as those by UNCDF and CGAP, among others, have sought to analyse similar trends. Our full report will consider these studies and some of the data challenges in more depth.
Nonetheless, our findings captured here show that mobile operators can see quantifiable commercial benefits from PAYG solar. The GSMA M4D Utilities programme encourages more mobile operators and PAYG providers to work together to better understand how they can jointly drive socio-economic and commercial impact through PAYG solar services.
The GSMA Mobile for Development (M4D) Utilities programme is funded by the UK Department for International Development (DFID), USAID as part of its commitment to Scaling Off-Grid Energy Grand Challenge for Development and supported by the GSMA and its members.